Comparing real estate metrics from one year to another can be challenging in a normal housing market due to the variability of different geographic markets. Unpredictable events can also have a significant impact on the circumstances and outcomes being compared. A good friend and client who served as COO of a large real estate development firm once told me that numbers are a version of fiction (he said he focussed more on the footnotes when it came to corporate statements). Same goes for headlines in the papers and online. Monthly comparisons can be extremely misleading, especially when context is lacking.
Thus, comparing this year’s numbers to the two ‘unicorn’ years we just experienced (June 2020 to June 2022) is virtually pointless. By ‘unicorn,’ we mean “Something that is greatly desired but difficult or impossible to find.”
The pandemic profoundly changed real estate over the last three years. The demand for a home of our own (especially away from The City) skyrocketed.
- Waves of first-time and second-home buyers entered the market.
- Already low mortgage rates were driven to historic lows.
- The forbearance plan all but eliminated foreclosures.
- Home values reached appreciation levels never seen before.
It was a market that forever had been “greatly desired but difficult or impossible to find.” A ‘unicorn’ year.
Now, things are getting back to normal. The ‘unicorn’ has vanished into the ether. Comparing today’s market to those years is quite misleading. Here are three examples:
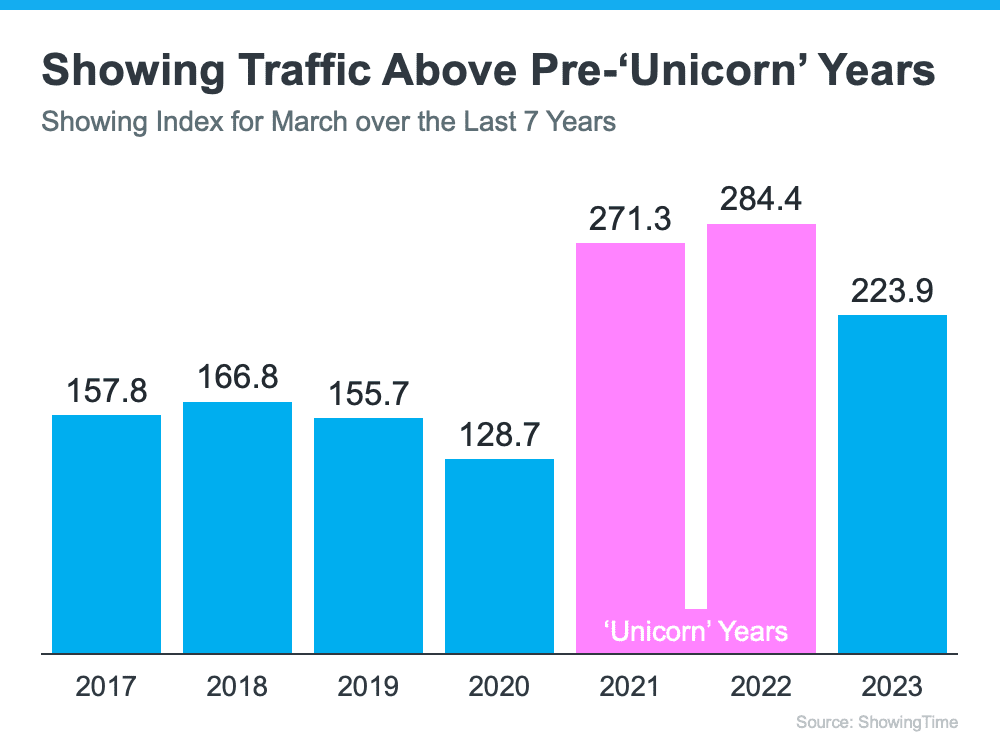
Buyer Demand
If you look at the headlines today, you’d think there aren’t any buyers out there. Yet buyer demand remains robust and we still sell over 10,000 houses a day in the United States. Of course, buyer demand is down from the two ‘unicorn’ years due to higher interest rates and affordability issues for some. But, according to ShowingTime, if we compare this year to normal years (2017-2019), buyer activity remains strong (see graph below):
Home Price Appreciation
We can’t compare today’s home price increases to the last couple of years. According to Freddie Mac, 2020 and 2021 each had historic appreciation numbers. Here’s a graph also showing the more normal years (2017-2019):
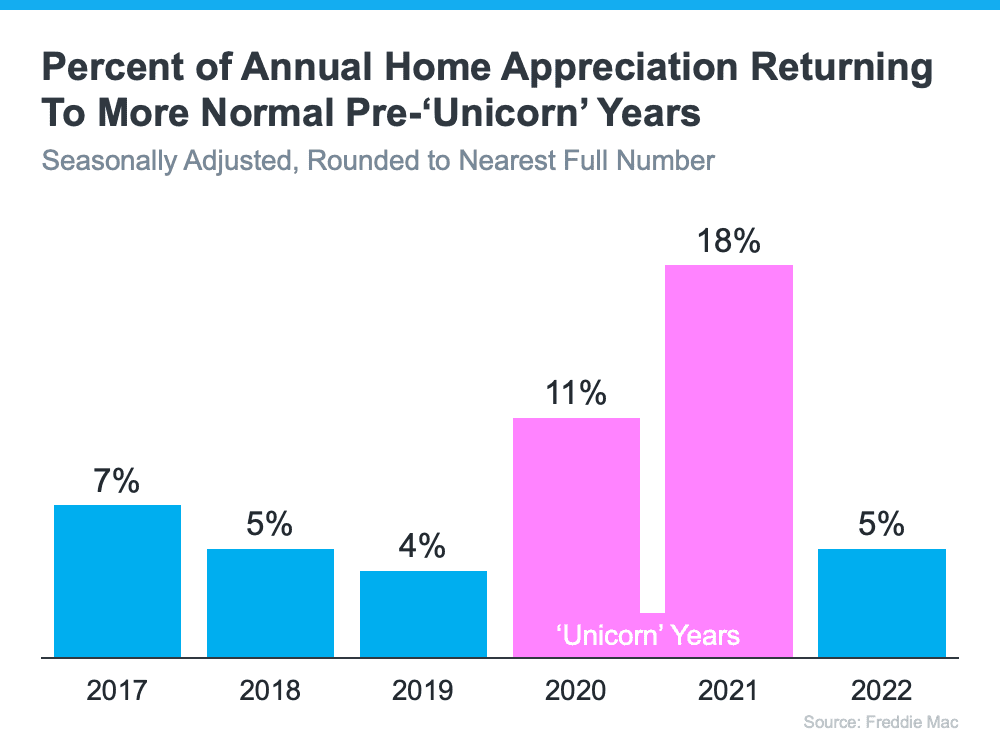
Looks to me like we’re returning to more normal home value increases. There were several months of moderate depreciation in the second half of 2022. However, according to Fannie Mae and Case-Schiller, the market has returned to more normal appreciation in the first quarter of this year.
Foreclosures
There have already been some provocative headlines about the percentage increases in foreclosure filings. Of course, the percentages will be up. They are increases when compared to the historically low foreclosure rates of the ‘unicorn’ years. Here’s a graph with information from ATTOM, a property data provider:
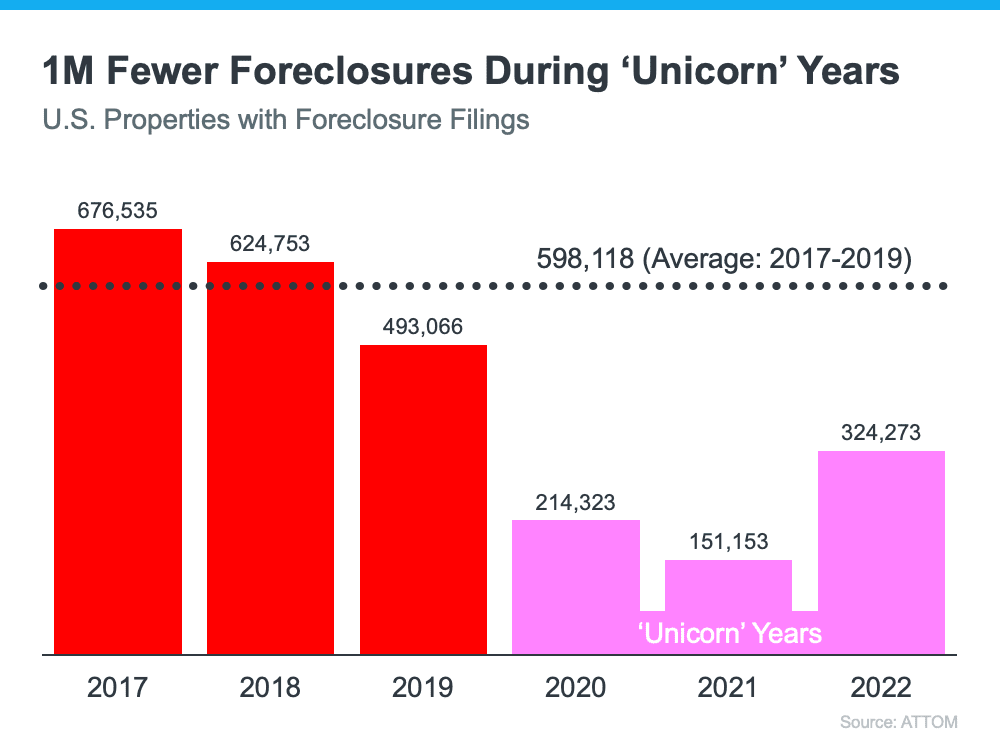
Of course, there will be an increase over the numbers of the last three years now that the moratorium on foreclosures has ended. There are homeowners who lose their home to foreclosure every year, and it’s heartbreaking for those families. But, if we put the current numbers into perspective, we’re actually going back to the normal level of filings from 2017-2019.
Bottom Line
There are always unsettling headlines around the housing market -- this year will be no exception. Most will come from inappropriate comparisons to the ‘unicorn’ years. Moreover, local Bay Area facts and figures are going to be different from those of other places. Remember that regional and national figures are often the polar opposite of what are experiencing here. Let’s connect so you have an expert on your side to help you keep everything in proper perspective. The Imagine Marin Group is here to help.