Statistics can be an enormously valuable tool for assessing the conditions and trends in the real estate market. However, they are also among the most misused, misquoted and misunderstood "facts" we are bombarded with. The only honest purpose for market statistics is to provide reasonably unbiased information for those trying to make decisions regarding the purchase, sale or ongoing ownership of real estate - typically the largest, most complicated (and most emotional) financial investments of one's life.
The problem is that most market analysis is provided by those who want to convince you to do something now; or by someone so attached to one position or another - the most common being either unrelenting optimism or unrelenting pessimism - that every statistic is twisted to justify that position; and/or those who don’t understand real estate market dynamics and are not qualified to interpret the data in the first place. Whether delivered by real estate agents, media pundits and analysts, reporters, bloggers, special algorithms, or the person who lives next door, all these situations often lead to the improper use of statistics.
RULE 1: Statistics without informed context generally have little value.
One can make virtually any case, positive or negative, by cherry-picking a single statistic derived from a particular data set and a specific period of time, whether that be the median sales price, foreclosure sales or the latest Case-Shiller Index. Small data set statistics can swing wildly without any significance. Computerized algorithms (Case-Shiller, Zillow) are not as flawless as they are presented to be by the media.
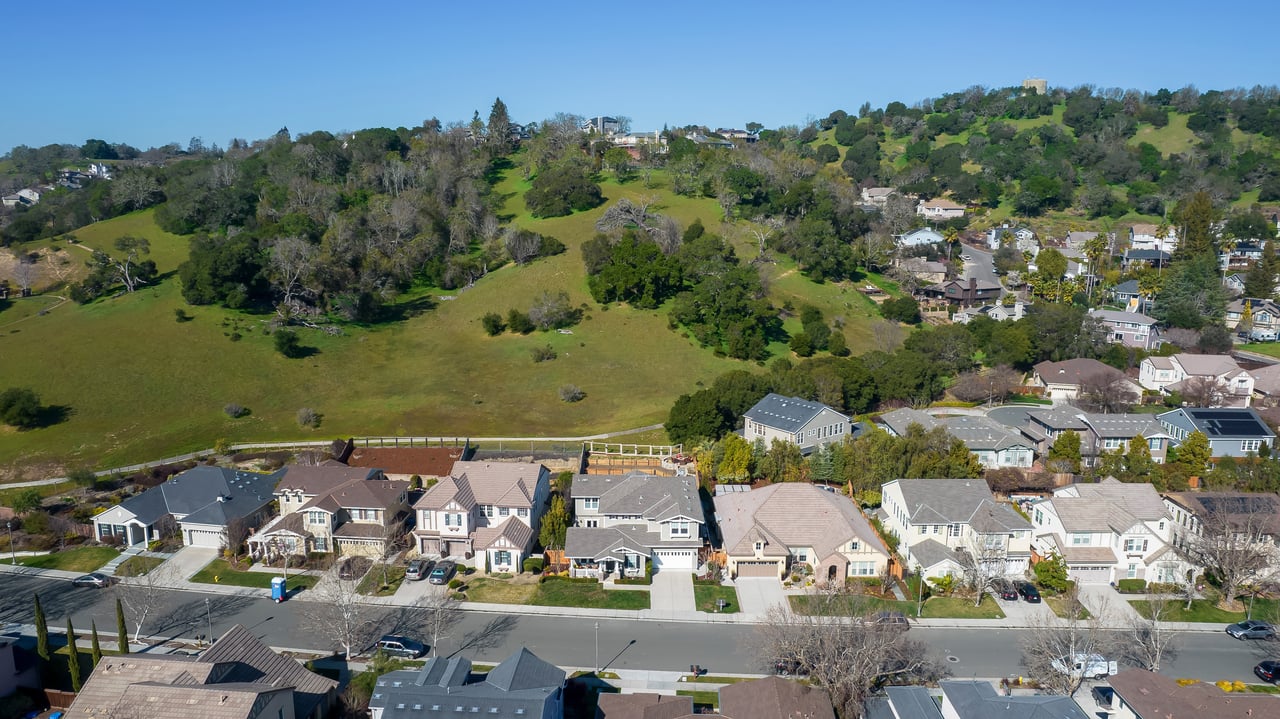
The overall national trend may misrepresent California’s; the state trend may misrepresent the Bay Area’s; the Bay Area's may misrepresent the city’s; the city’s trend may misrepresent the trend in a specific neighborhood, price segment or property type. Within the Bay Area (and Marin), distinct neighborhood and community market segments can move in different directions or at varying speeds.
One needs to know a specific market inside out, from the ground up, first to carefully vet the data for statistical flaws, outliers, or anomalies, and then, standing back to look at the larger picture, to be able to intelligently interpret what it appears to signify for the present and for the future. Having a sense of the longer-term cycles in financial and real estate markets is also helpful: markets neither go up forever or down forever - it's amazing how often this simple fact is forgotten in the drama of the moment.
RULE 2: Statistics, including medians and averages are gross generalities.
They often fluctuate up and down in the short term even in stable markets and price statistics are often affected by other factors besides changes in fair market value, such as seasonality, available inventory, financing conditions, buyer profile and significant changes in the distressed-property, new-construction or luxury home market segments, or sudden economic, political or environmental events. In most Bay Area markets, every month sees a relatively small number of relatively unique properties sell. Median and average values usually disguise an enormous disparity of values among the underlying individual home sales in the data set, and how they apply to any particular property is impossible to say without a specific comparative market analysis (CMA). To value a specific property, an analysis crafted to its exact location, condition, circumstances and amenities, is required.
With real estate, the devil is always in the details. To further complicate matters, there are three different ways to calculate months supply of inventory (MSI), two ways to measure average days on market, and two ways to calculate average dollar per square foot values. Square footage itself can be measured in very different ways by architects, builders, appraisers and floor-plan illustrators. For that matter, average and median prices can sometimes show different trends up or down, or price statistics can go up at the same time average dollar per square foot values are going down, and vice versa. All these variations make it that much easier to cherry-pick one single statistic to substantiate some overarching claim regarding where the market is heading.
RULE 3: Be careful about grand conclusions based on any one factor.
Any definitive trend will be reflected over the longer term and in more than a single statistic, i.e. not just last month's median sales price (as quoted in most media articles), but in a wider array of supply, demand and value measures, such as dollar per square foot, months supply of inventory, sales volume, percentage of listings accepting offers, days on market, and so on.
We prefer to look at as many different statistical angles on the market as we can think of, to see how they do or don't line up, and prefer quarterly or longer-term data to ever-fluctuating monthly data. Longer-term trends really allow one to step back and see the larger view, instead of just what is in front of one’s shoe.
A common mistake of human beings is what I call the “insufficient data set” problem: They come to definitive conclusions on what is going on in the market based solely upon their own experience and perhaps those of a few people they know. What happened to you in your last offer, or in listing your home for sale, or to your sister-in-law, does not necessarily represent the overall reality.
RULE 4: No one knows the future.
This is perhaps the most important point. Recent studies suggest that the confident predictions of financial market pundits and experts are wrong 50% of the time - or more. One business professor compared them to monkeys throwing darts. Generally speaking, you would do as well or better just flipping a coin.
It has been found that the most reliable experts are also the most humble, people who constantly double-check and question their own conclusions. The more confident (or arrogant) a pundit is about what is to come, the more you should distrust their opinions. Financial and real estate markets are now subject to an astounding number of constantly changing, local, national and international, economic, political and even ecological factors. Even a super computer can’t track all the spinning factors and figure out what the future will look like tomorrow.
At Imagine Marin, we are not immune to the failings that afflict other analysts, but we try our best to provide straightforward information regarding market conditions, from as many angles and with as much detail and context as possible, so that you can make your own informed decisions. Very few of our charts are created automatically by computer: almost all the data is personally investigated and vetted for anomalies before being charted. We make very few predictions, but when we do make a tentative forecast, with lots of caveats, it is based upon what appears to us to be overwhelming supply-and-demand conditions and decades of experience in San Francisco Bay Area real estate. However, we cannot predict the future either.
By Patrick Carlisle, Chief Market Analyst, San Francisco Bay Area, Compass. This article has been modified.