What's Been Happening?
This spring in Novato, fewer homes sold, they took a little longer to sell — and prices still went up. The reason is tight supply, and the citywide headline hides three very different ZIP-code stories.
- 113 single-family homes sold (March 1–June 1, 2026), down ~8% from 123 a year earlier.
- Median sale price: $1,375,000, up 3.0% year over year.
- Median price per square foot: $644, up 4.7% — and higher in every Novato ZIP code.
- Average days on market: 31 (vs. 28 last spring).
- Inventory is tight: ~124 homes for sale or under contract today (76 active) — about 2.0 months of supply, still a seller's market.
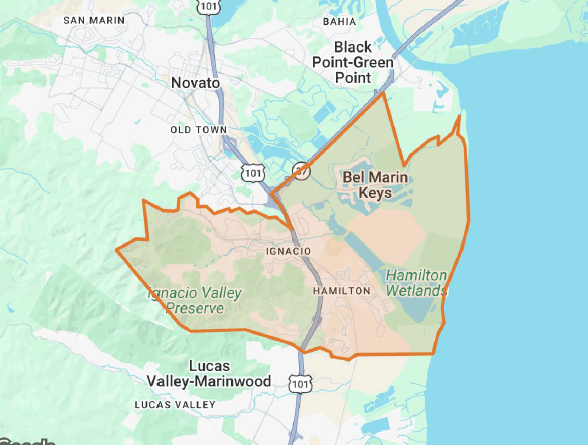
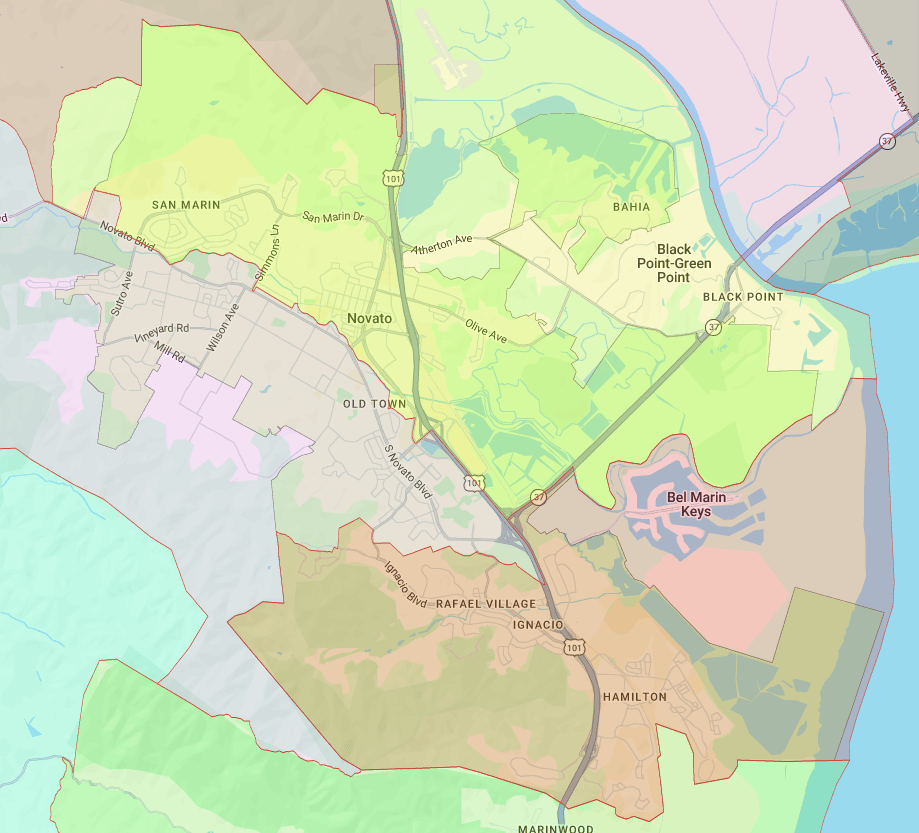
If you only read the citywide median, you'd miss what's actually happening in Novato. The truth lives at the ZIP-code level — where 94945 (Central Novato & Downtown), 94947 (West Novato, San Marin & Indian Valley) and 94949 (South Novato, Bel Marin Keys & Hamilton) are behaving like three separate markets. Below is the full breakdown, built from BAREIS MLS single-family data for the spring window (March 1–June 1) in 2026 versus the same window in 2025.
Novato market at a glance: spring 2026 vs. 2025
| Metric | Spring 2026 | Spring 2025 | Change |
|---|---|---|---|
| Homes sold (single-family) | 113 | 123 | −8.1% |
| Median sale price | $1,375,000 | $1,335,000 | +3.0% |
| Median price / sq ft | $644 | $615 | +4.7% |
| Average days on market | 31 | 28 | +3 days |
| Homes for sale now (active) | 76 active · 124 including pending & contingent | ||
Source: BAREIS MLS. Single-family detached homes, sold March 1–June 1. "Sold" includes off-MLS recorded sales.
Are Novato home prices going up or down in 2026?
Up. It's counterintuitive, but the most reliable measure of value — price per square foot — rose in all three Novato ZIP codes, between 4.1% and 5.9%, for a citywide gain of 4.7%. The number of sales fell, yet prices climbed. That combination almost always means one thing: supply is tight. With roughly 2.0 months of inventory citywide, sellers still hold the upper hand, and well-priced homes are moving in three to five weeks.
The lesson for the rest of this report: don't trust a single median in isolation. A median can swing simply because the mix of homes that sold changed — and that's exactly what makes Novato's three ZIPs look so different this spring.
📺 Watch the video version and browse the full Imagine Marin video library.
Novato ZIP code comparison: 94945 vs. 94947 vs. 94949
| ZIP & area | Homes sold | Median price | $ / sq ft | Avg DOM | Months of supply |
|---|---|---|---|---|---|
| 94945 · Central / Downtown | 44 (+16%) | $1,242,500 (+1%) | $614 (+5.9%) | 31 | ~1.4 (tightest) |
| 94947 · West / San Marin | 35 (−33%) | $1,350,000 (+13%) | $642 (+4.1%) | 37 | ~3.1 (most balanced) |
| 94949 · South / Bel Marin Keys | 34 (+3%) | $1,550,000 (−13%) | $719 (+4.7%) | 24 (fastest) | ~1.8 |
Months of supply = active listings ÷ recent monthly sales pace. Lower = more competitive for buyers. Source: BAREIS MLS.
94945 — Central Novato & Downtown: the workhorse
ZIP 94945 is the engine of the Novato market. It logged 44 sales — about 39% of the entire city — and it's the only ZIP where sales actually rose (+16%) while homes sold faster (down to 31 days). It's also the most affordable, with a median of $1,242,500, and it posted the biggest value gain in town: price per square foot up 5.9%. With roughly 1.4 months of supply and the strongest demand pressure in Novato (nearly one home under contract for every active listing), this is where buyers priced out of pricier neighborhoods compete — and that competition is lifting values fastest. See current Novato listings →
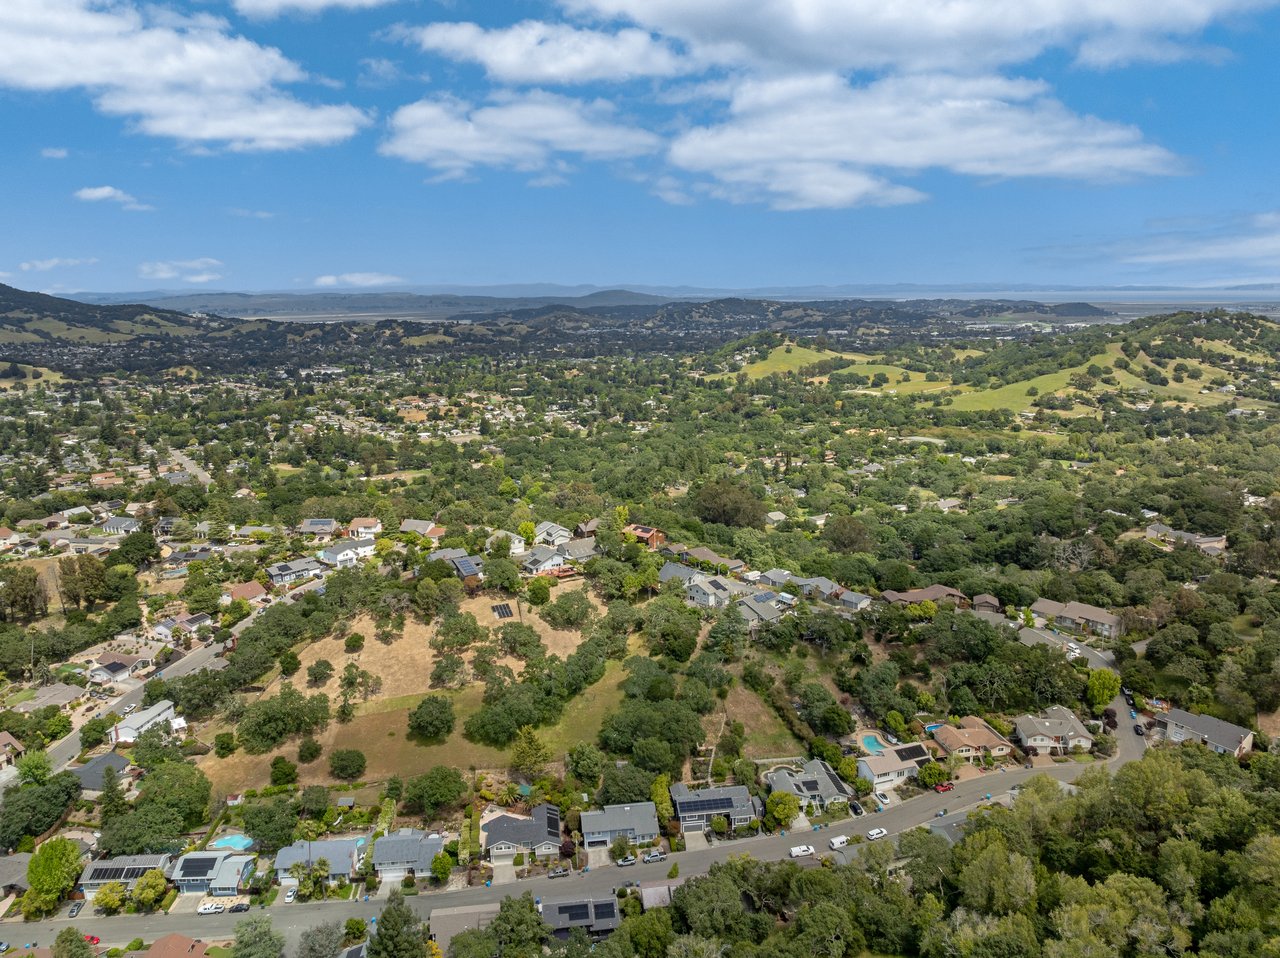
94947 — West Novato, San Marin & Indian Valley: fewer, bigger trades
ZIP 94947 looks like a contradiction: sales fell by a third (52 → 35), yet the median jumped 13% to $1,350,000. Both are true, and both point to a mix shift — fewer homes traded, and the ones that did were larger and pricier. Underlying value rose a steadier 4.1% per square foot. Just as important, 94947 is the most balanced market in Novato: about 3.1 months of supply, the most active listings (36), and the slowest pace (37 days). For buyers, that simply means more to choose from here than anywhere else in town. Read the Buyer's Guide →
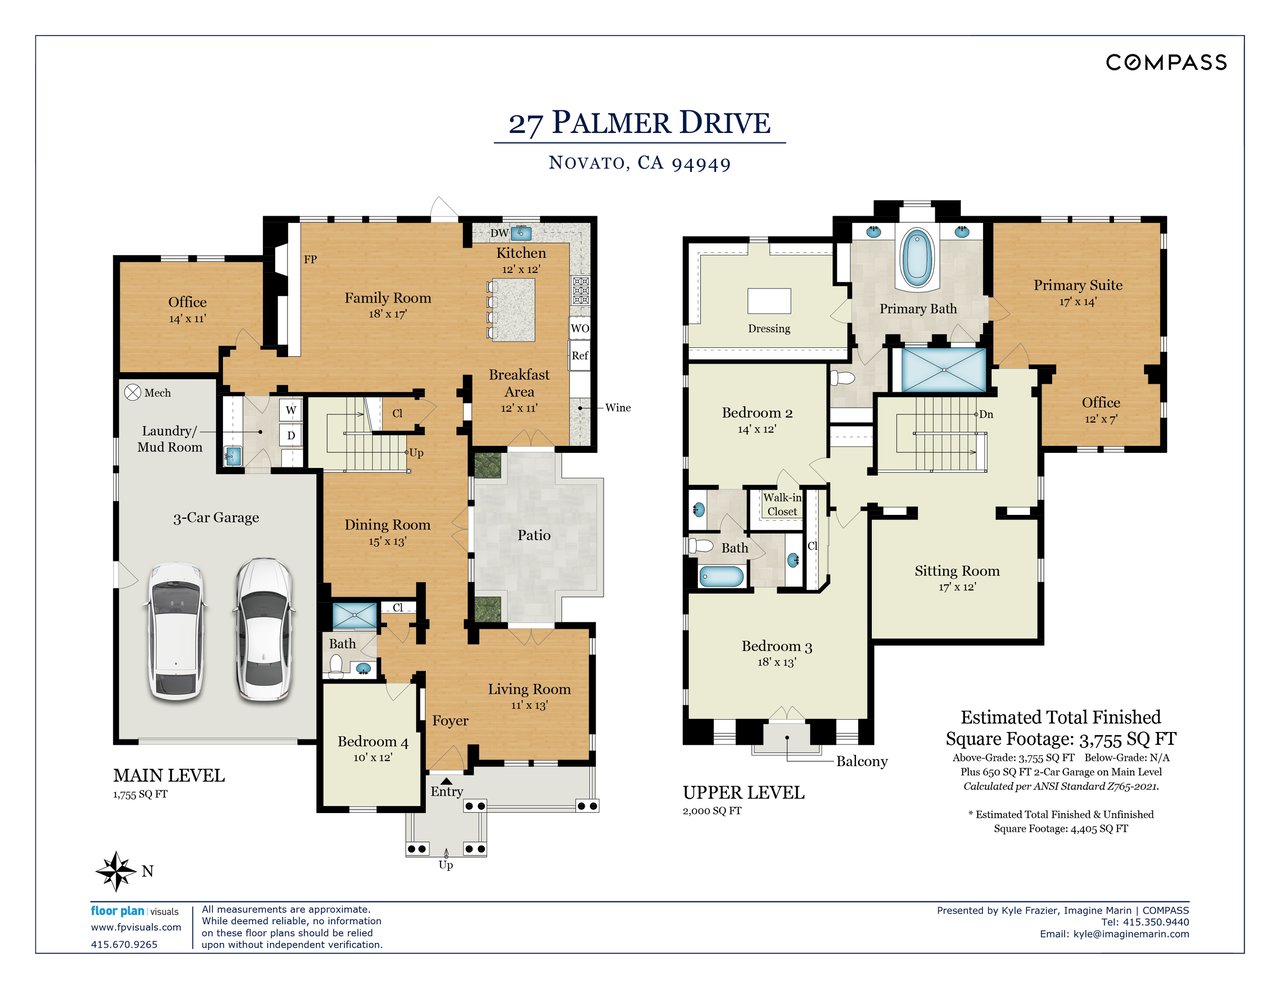
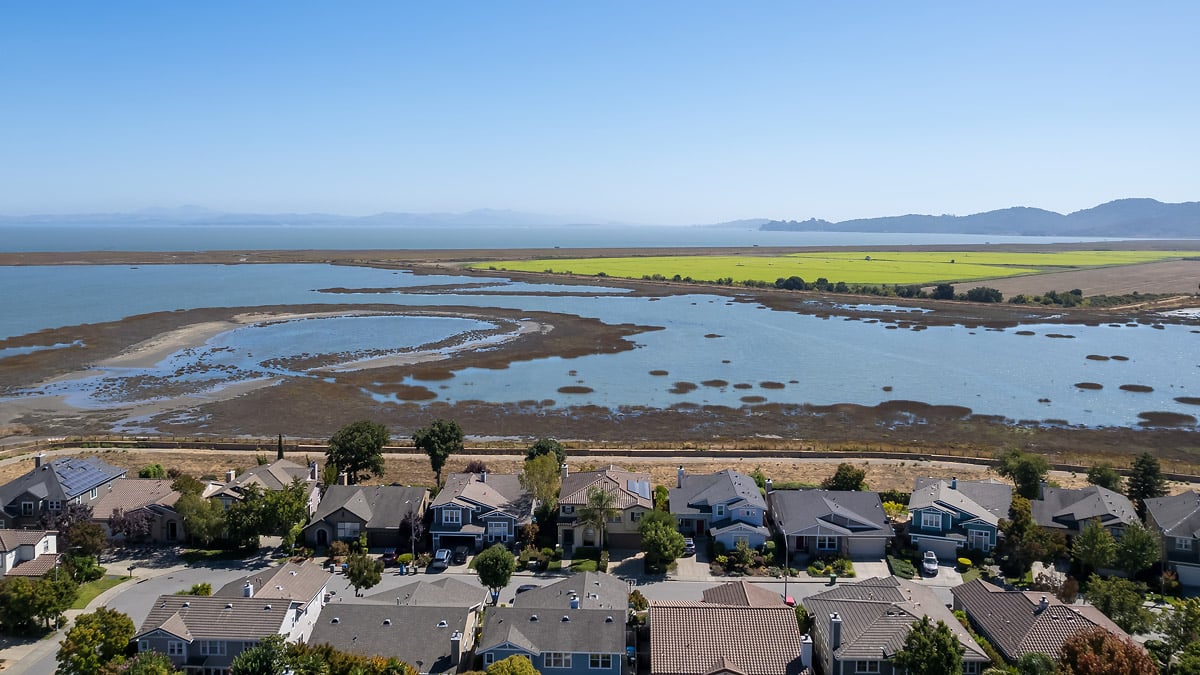
94949 — South Novato, Bel Marin Keys & Hamilton: the head-fake
ZIP 94949 is the most misunderstood number in this report. The median fell $235,000 (−13%) to $1,550,000 — which looks like a price drop in Novato's priciest area. It isn't. Price per square foot actually rose 4.7%, and these homes sold in just 24 days, the fastest in Novato. The median dipped only because the mix of homes that sold shifted (fewer ultra-high-end trophy sales this spring), not because values declined. Per square foot and per day on market, 94949 is the strongest, most in-demand ZIP in the city.
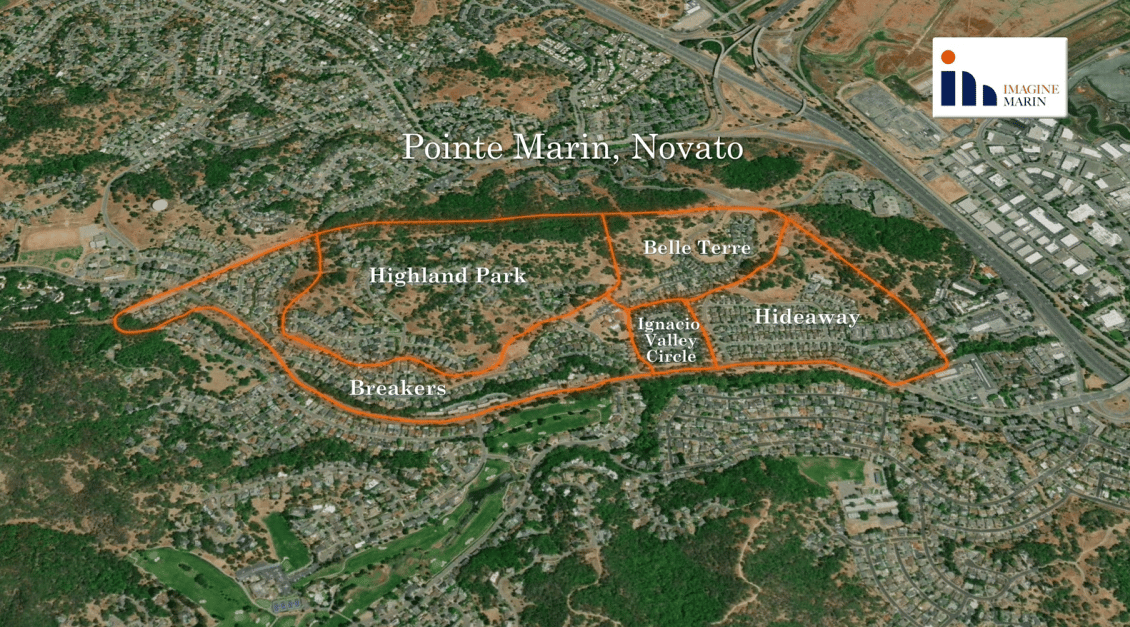
94949 also contains Novato's most sought-after enclaves. Explore the neighborhood guides for Bel Marin Keys, Hamilton Field, Pointe Marin, Marin Country Club Estates and Loma Verde. For a closer look, watch the Hamilton Field Novato real estate update.
Is Novato a buyer's or seller's market right now?
It's still a seller's market overall — but the degree depends on the ZIP. Months of supply (active listings divided by the recent monthly sales pace) is the clearest gauge: under ~3 months favors sellers, 3–6 is balanced.
- 94945 — ~1.4 months: the hottest, most competitive sub-market in Novato.
- 94949 — ~1.8 months: tight and fast, with premium pricing.
- 94947 — ~3.1 months: approaching balanced; the friendliest ZIP for buyers who want options.
The spread between Novato's most affordable and most expensive ZIP is about $307,500 in median price — a reminder that "the Novato market" is really several markets with different strategies for buyers and sellers.
What this means if you're selling in Novato
Values are up, inventory is low, and well-priced homes are still selling quickly — a favorable backdrop. But the wide gap between median and price-per-square-foot trends shows this is a market that rewards precise pricing and punishes guesswork. Start with an accurate, data-backed valuation rather than a portal estimate. Request a Novato home valuation (second opinion) → or review the Seller's Guide.
What this means if you're buying in Novato
Competition varies sharply by ZIP. If you want the most selection and negotiating room, 94947 currently offers it; if you're targeting 94945 or 94949, expect to move quickly and compete. Many of the best opportunities never hit the public portals — see off-market homes in Marin and start your Novato home search.
Want the data for your exact street?
The citywide and ZIP numbers are a starting point — your block can tell a different story. Get a free, no-obligation Novato home valuation, or reach Kyle Frazier directly at (415) 350-9440 · [email protected].
Frequently asked questions about the Novato housing market
What is the median home price in Novato, CA in 2026?
The median sale price for single-family homes in Novato was $1,375,000 in spring 2026 (March 1–June 1), up about 3% from $1,335,000 a year earlier (BAREIS MLS).
Are Novato home prices going up or down in 2026?
Up. Sales volume fell about 8% year over year, but the median rose 3% and price per square foot rose 4.7% — increasing in all three ZIP codes (94945, 94947, 94949).
Which Novato ZIP code is the most expensive?
94949 (South Novato — Bel Marin Keys, Hamilton Field, Pointe Marin, Marin Country Club Estates), with a spring 2026 median of $1,550,000 and the highest price per square foot at $719.
Which Novato ZIP code is the most affordable?
94945 (Central Novato & Downtown), with a median of $1,242,500 — and it made up roughly 39% of all single-family sales.
How fast are homes selling in Novato?
About 31 days on market on average. 94949 is fastest (24 days); 94947 is slowest (37 days).
How many homes are for sale in Novato right now?
Roughly 76 active listings, or about 124 including homes under contract, across the three ZIP codes — about 2.0 months of supply.
Methodology & data source
All figures are drawn from the BAREIS MLS and cover single-family detached homes with a close date between March 1 and June 1, compared year over year (2026 vs. 2025). "Homes sold" includes recorded off-MLS sales. Median price and median price per square foot are used (rather than averages) because they're more resistant to distortion from a single very-high or very-low sale. Months of supply is calculated as current active listings divided by the trailing monthly sales pace for the window. Figures are rounded; this report is informational market commentary, not an appraisal or financial advice. Information is deemed reliable but not guaranteed.